Downtime Tracker
Why the line stopped, for how long, and who fixed it.
Andon · OEE
Records every stop on the assembly line with its station, cause and fix; calculates efficiency (OEE) live and puts the biggest loss in front of you every morning. “Andon” is the name of the line’s problem-signal system.
Today and after
Today: Stops get written on a whiteboard, or not at all.
With Downtime Tracker: A stop is logged in two taps; its duration counts itself.
Today: Which station loses how much time is a guess.
With Downtime Tracker: The biggest loss by station and cause, live.
Today: At month end, nobody can say why the line is behind plan.
With Downtime Tracker: Shift handover and monthly analysis ready.
What it does
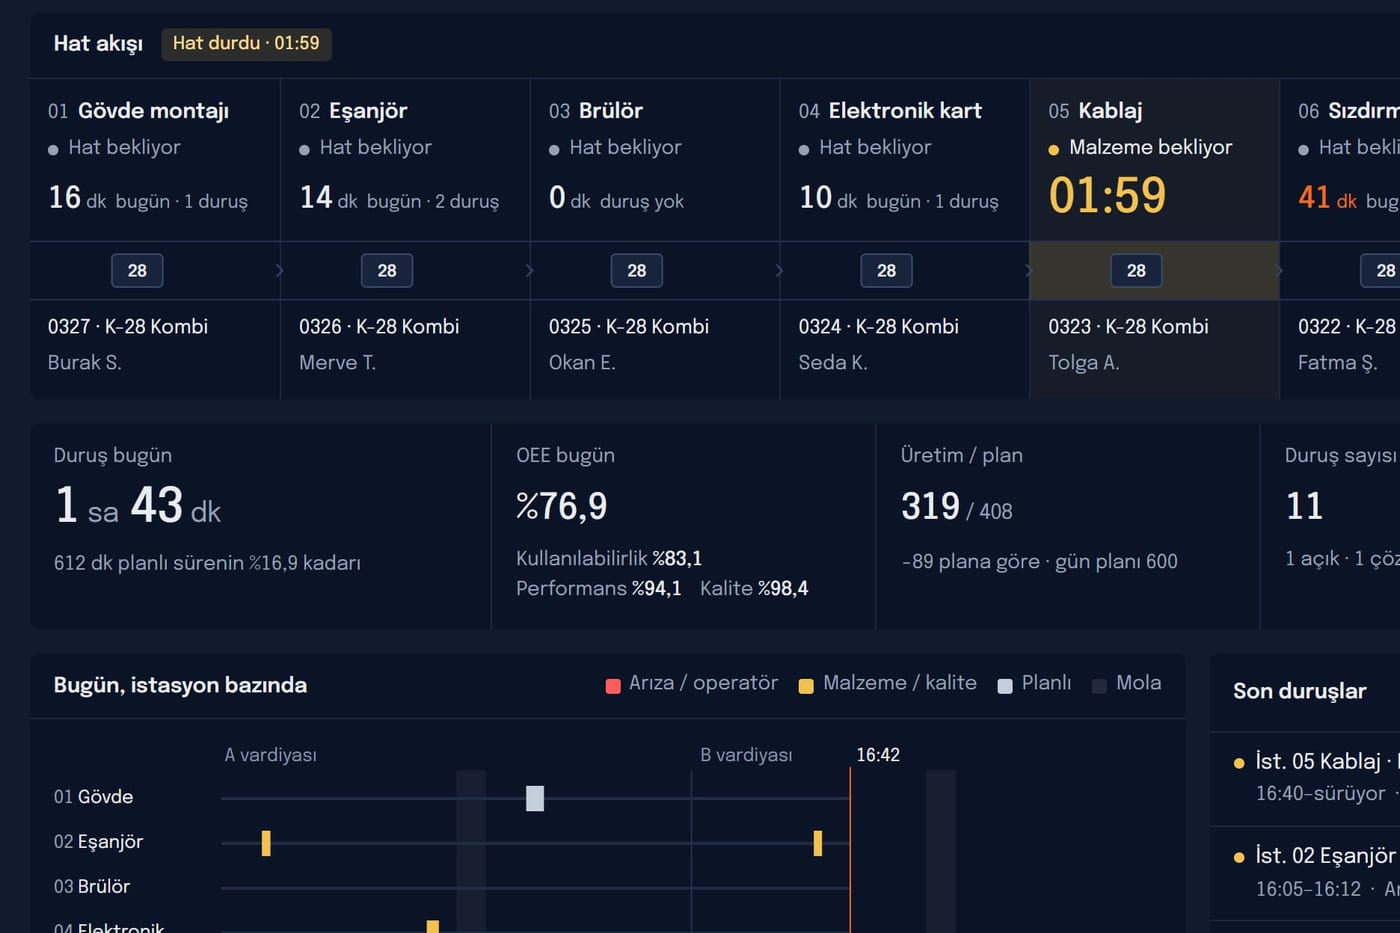
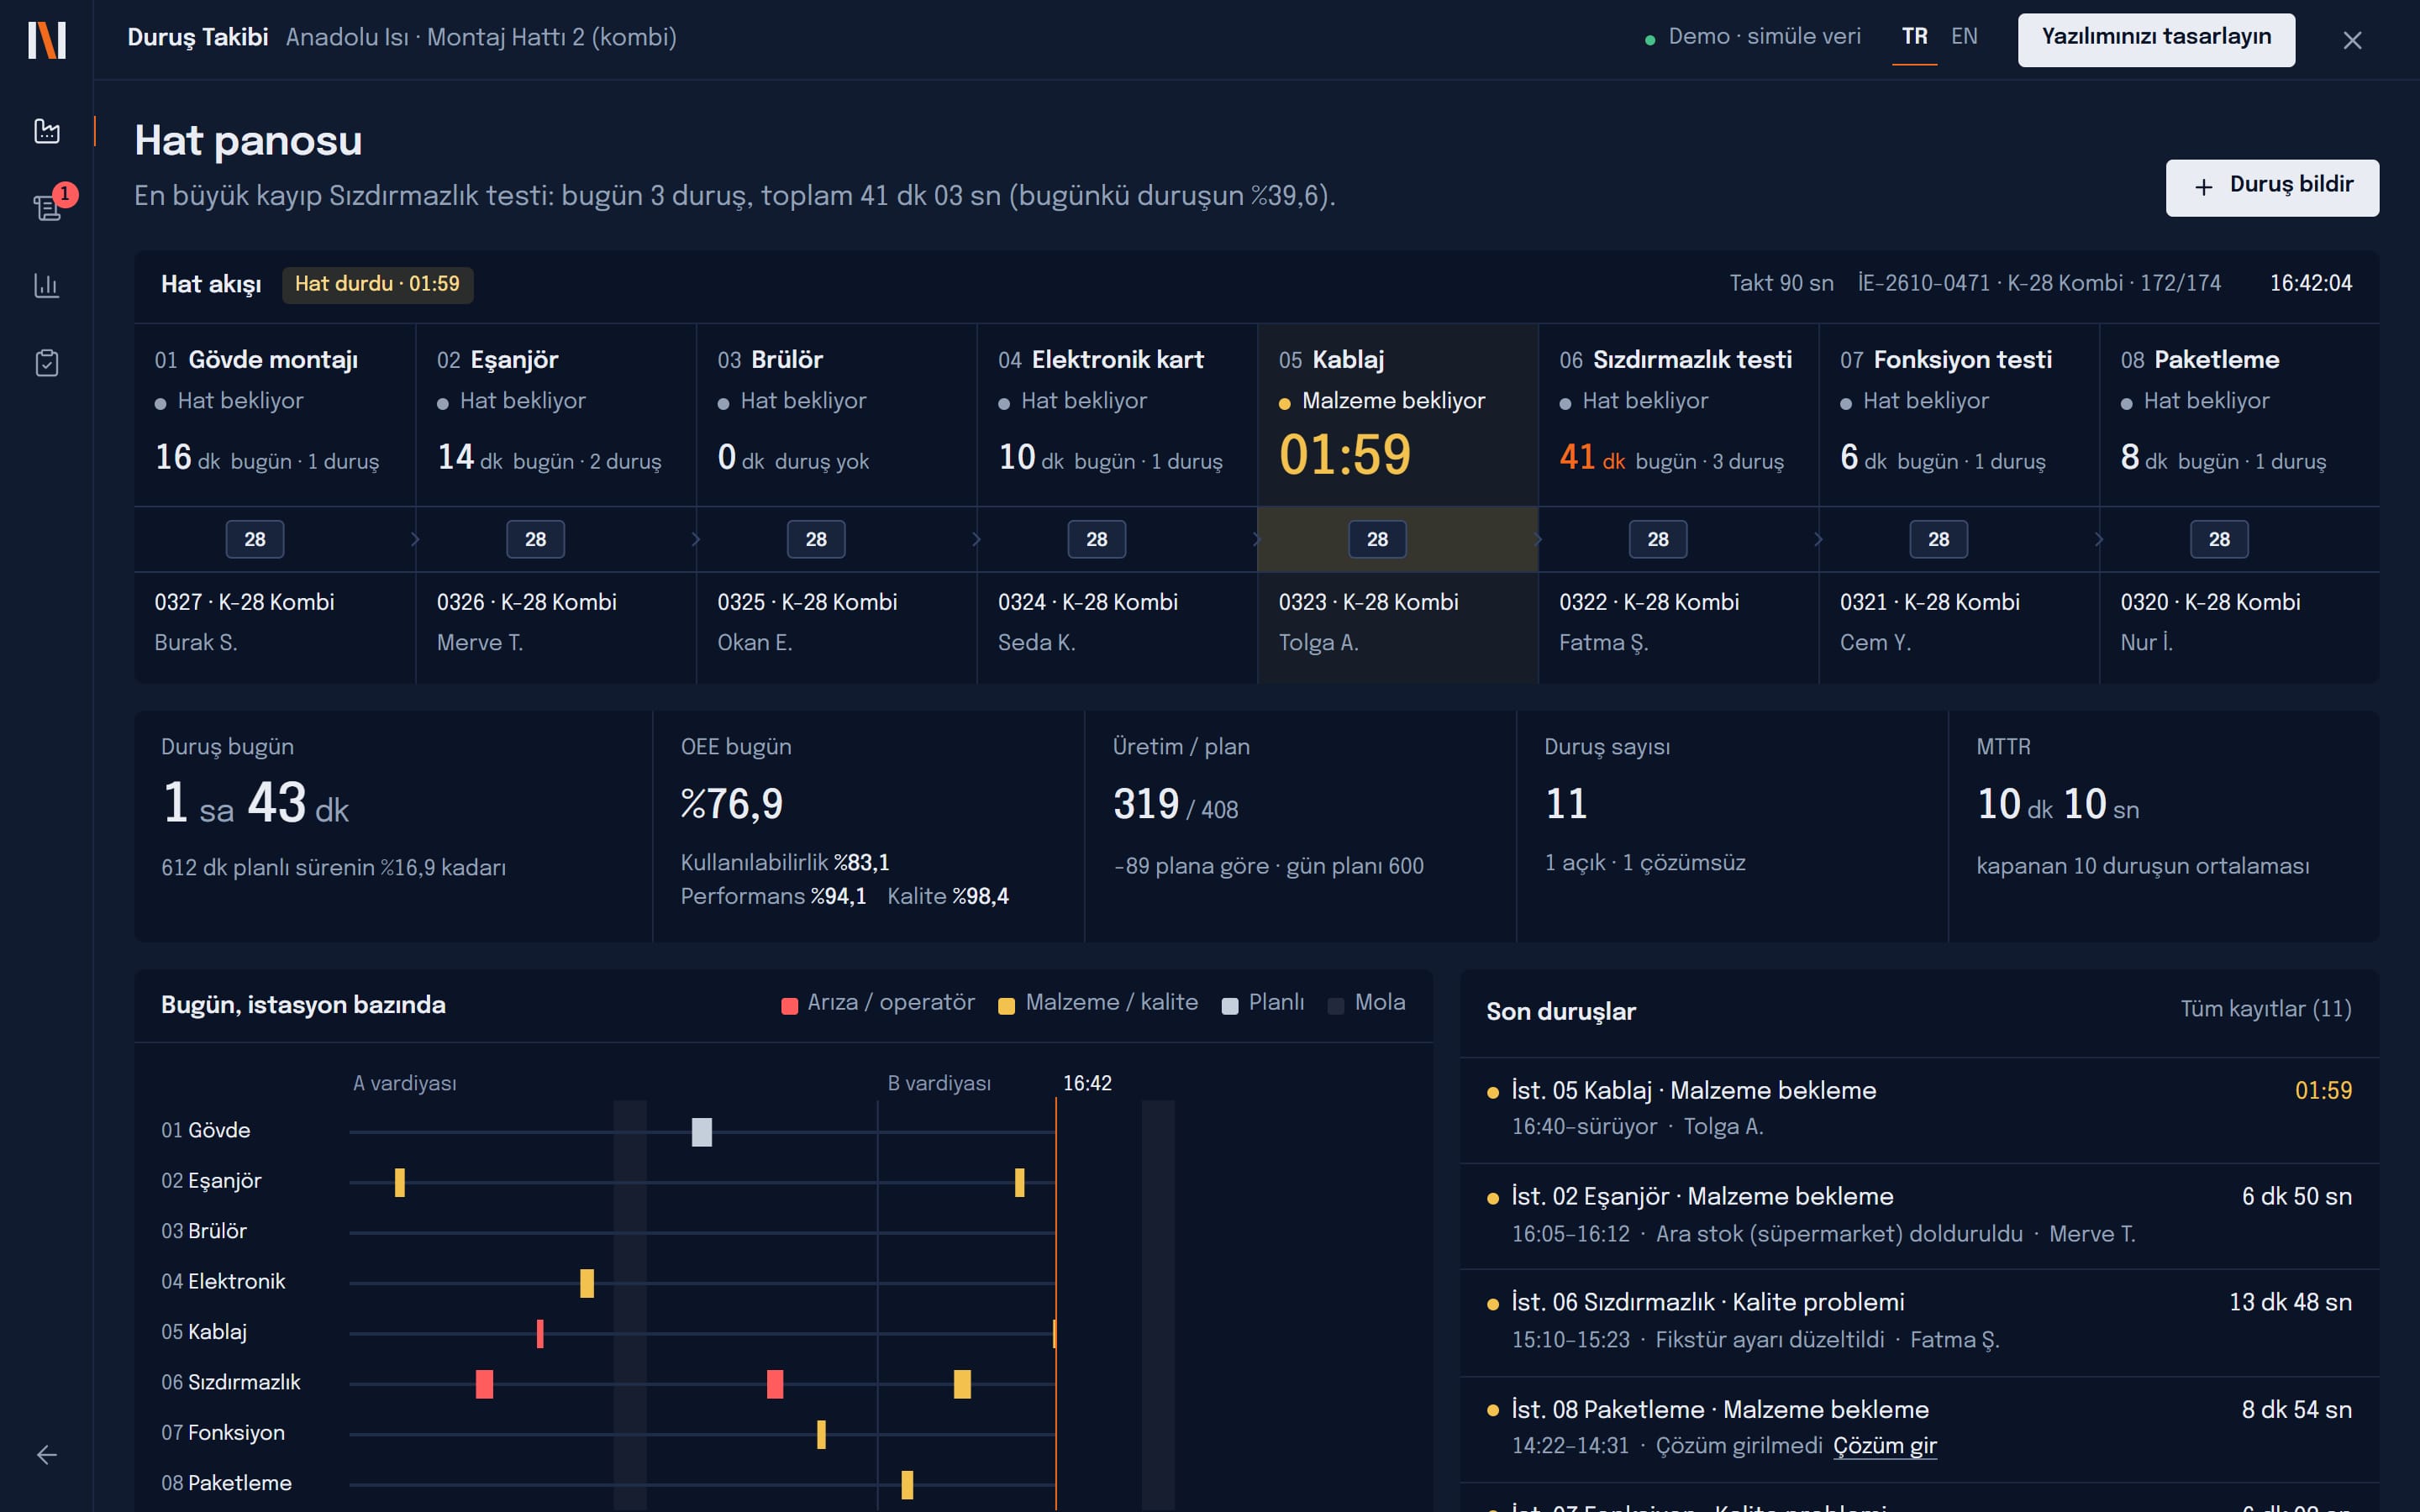
Station board
The line station by station, live: running, stopped, waiting for material, on quality hold.
Two taps to log
Start the stop, pick the cause; when it ends, pick or type the fix.
Product model from the PLC
Every record carries the model in production, read from the PLC.
Live OEE
Availability, performance and quality on their own; plan and actual side by side.
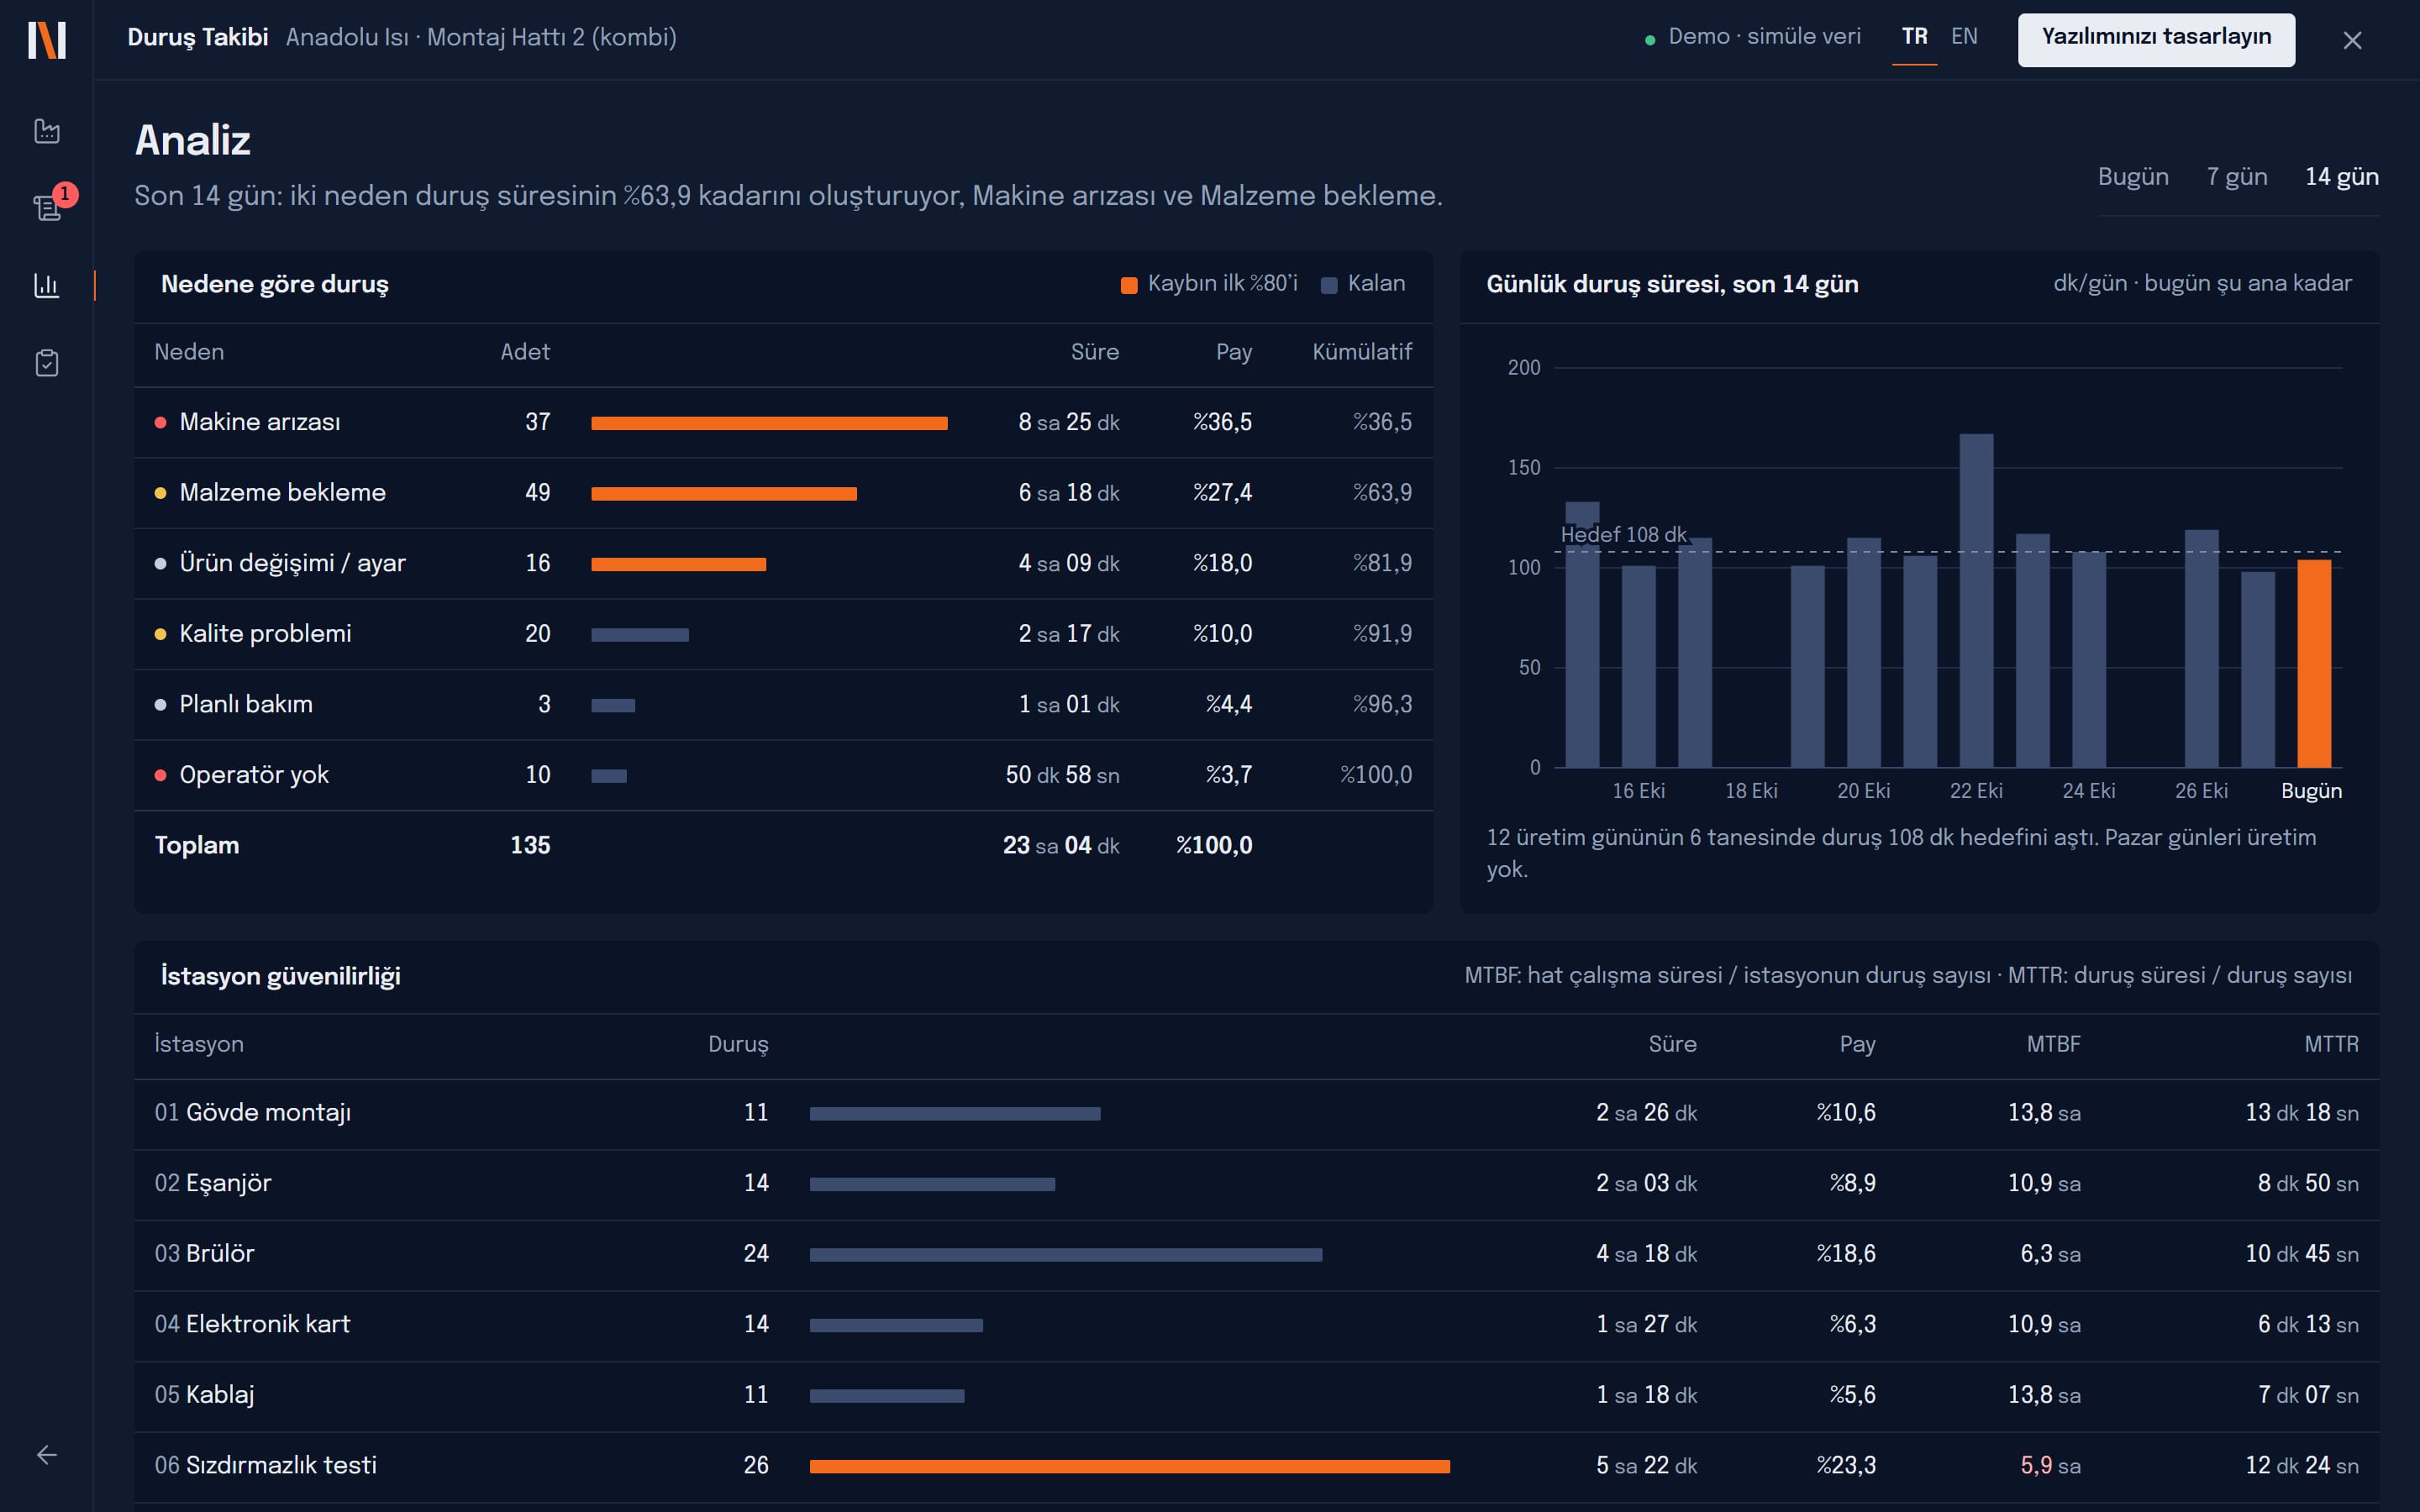
Pareto analysis
Losses by cause and by station; a 14-day trend, MTBF and MTTR.
Export and shift handover
CSV, Excel, PDF; open issues and notes for the next shift.
What it connects to
- PLC model and counters
- Andon lights and buttons
- Line screens (TV)
- Operator tablets
- ERP production orders
Sensors it works with
Platforms this app is part of
A typical project
- Scope
- One line, 6–20 stations, operator tablets and a line screen.
- Duration
- 3–6 weeks
The demo runs entirely in your browser on simulated data. Let us talk about how it would look on your own line.